
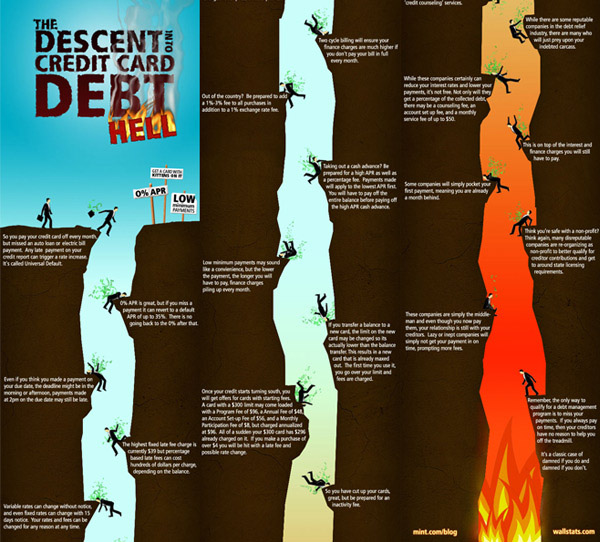
I have been tasked with visually putting together some statistics (and at first I thought to myself - UUURRRRGGGGG, I really don't feel like doing this, but as with any project I started by doing some research and thought to myself: "look Lecia, if you're gonna do this just try to make it fun for yourself and make the project interesting even if it's just a really small project"
One thing that has hit home again is that Info Graphics can take the boring statistic and make it interesting to the viewer allowing them to experience the information provided as apposed to just blindly processing the information in front of them!


No comments:
Post a Comment